Need instructions for mobile?
Bot MD Care allows you to download individual patient Graphs & Tables and even gives you the option to send them via email.
Via Patient Monitoring
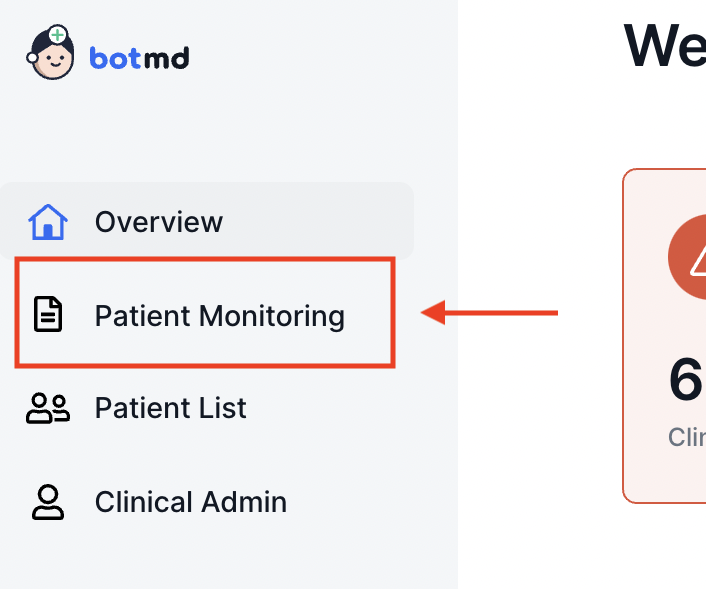
1. In the left side of the Clinical Dashboard, Click Patient Monitoring
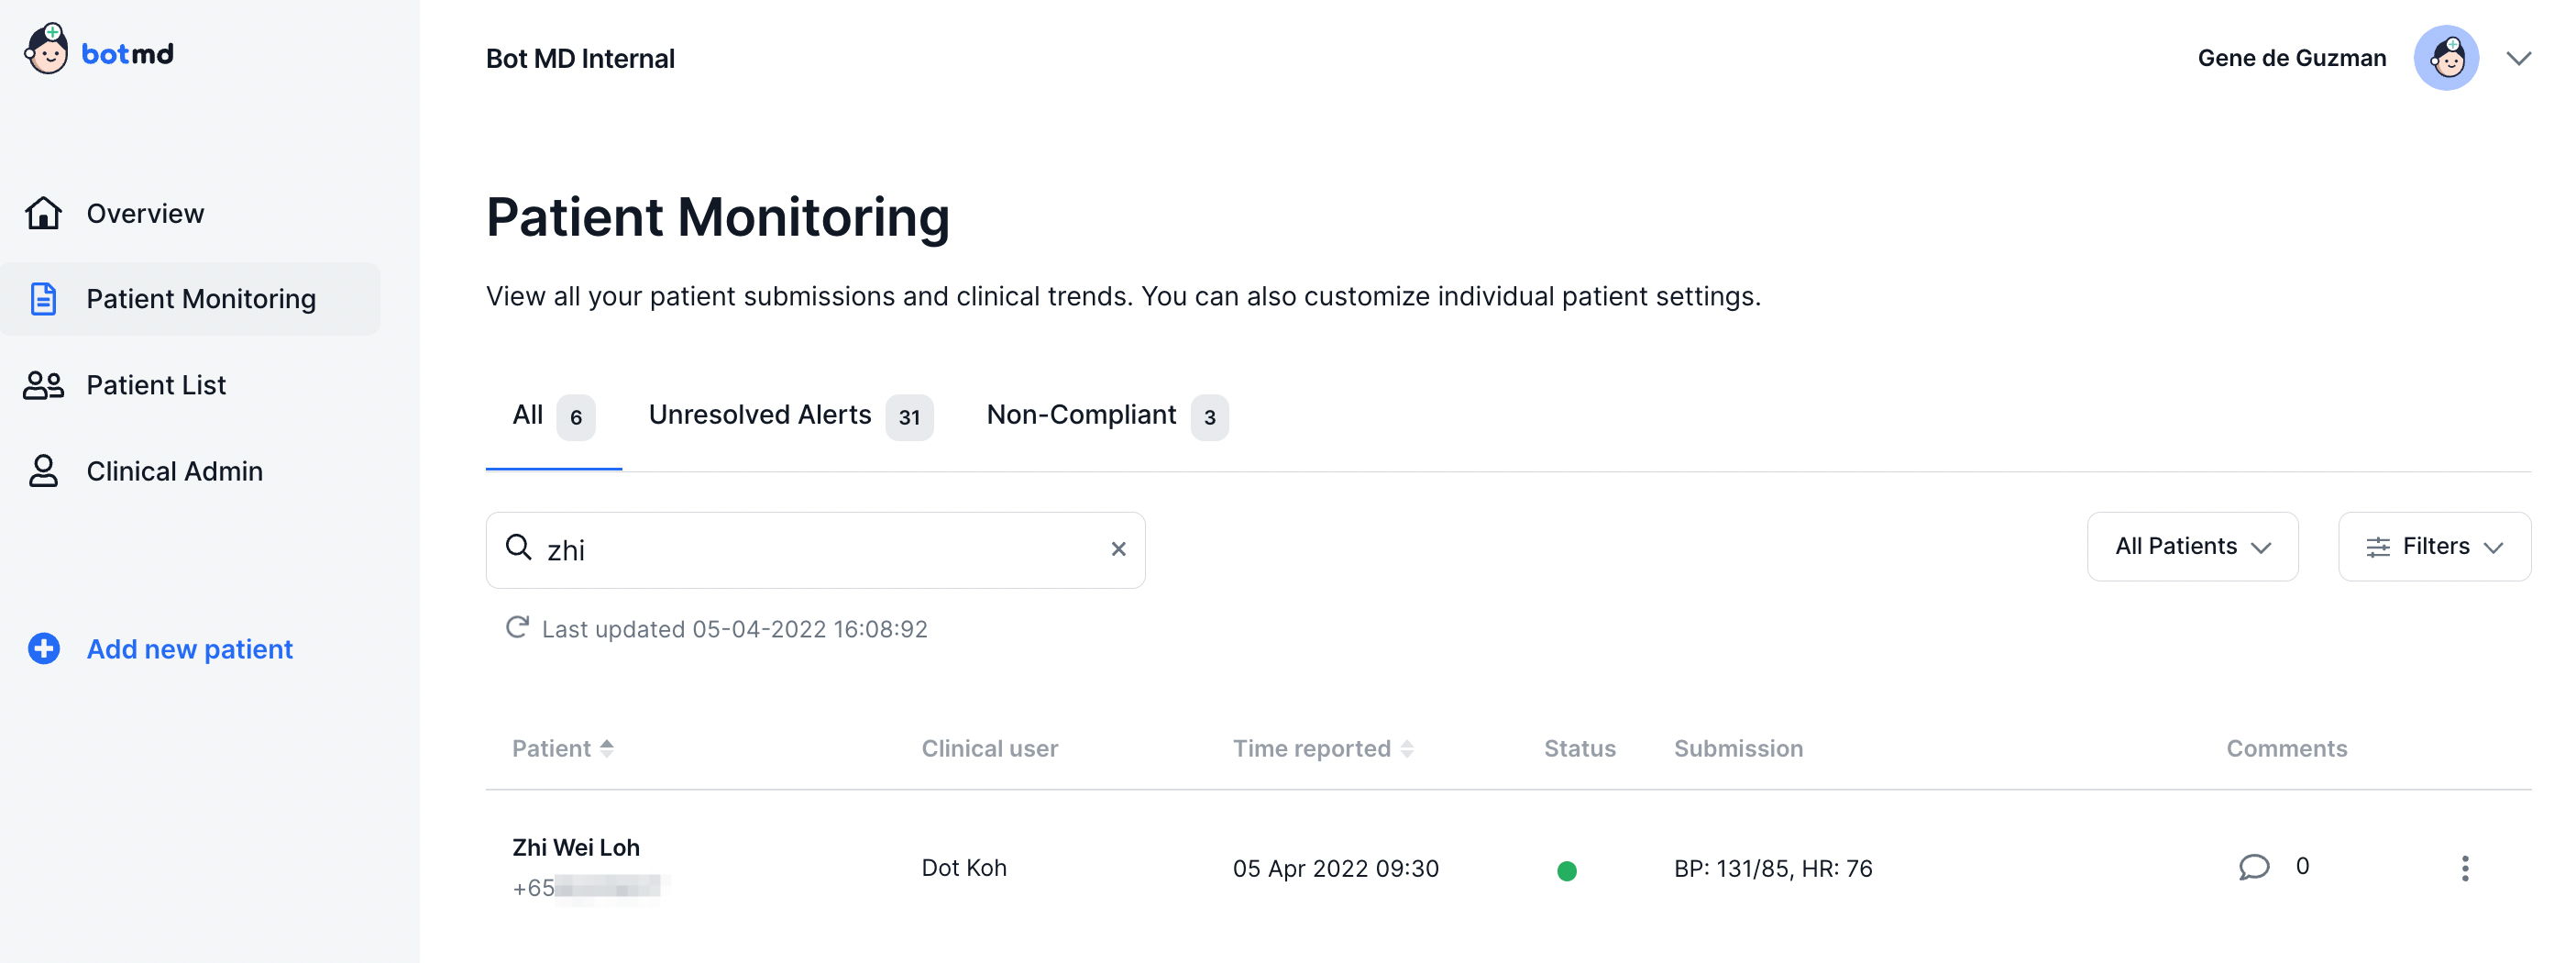
2. Select the All tab to see a list of all patients currently being monitored. You may type the patient's name in the search field or select from the list below.
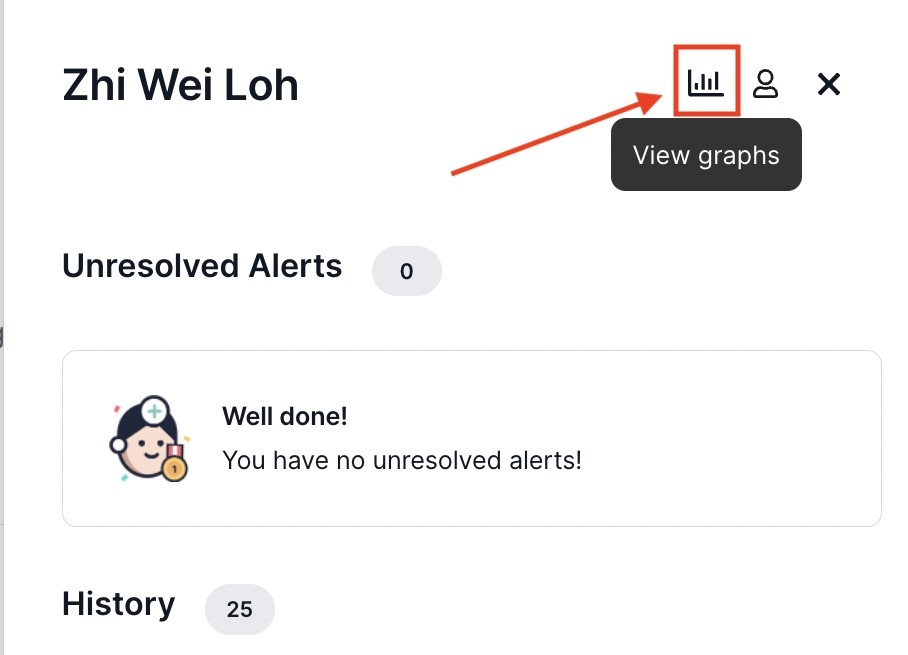
3. Click on your patient's submission and on the flyout, click on the mini graphs icon to view your patient's graphs.
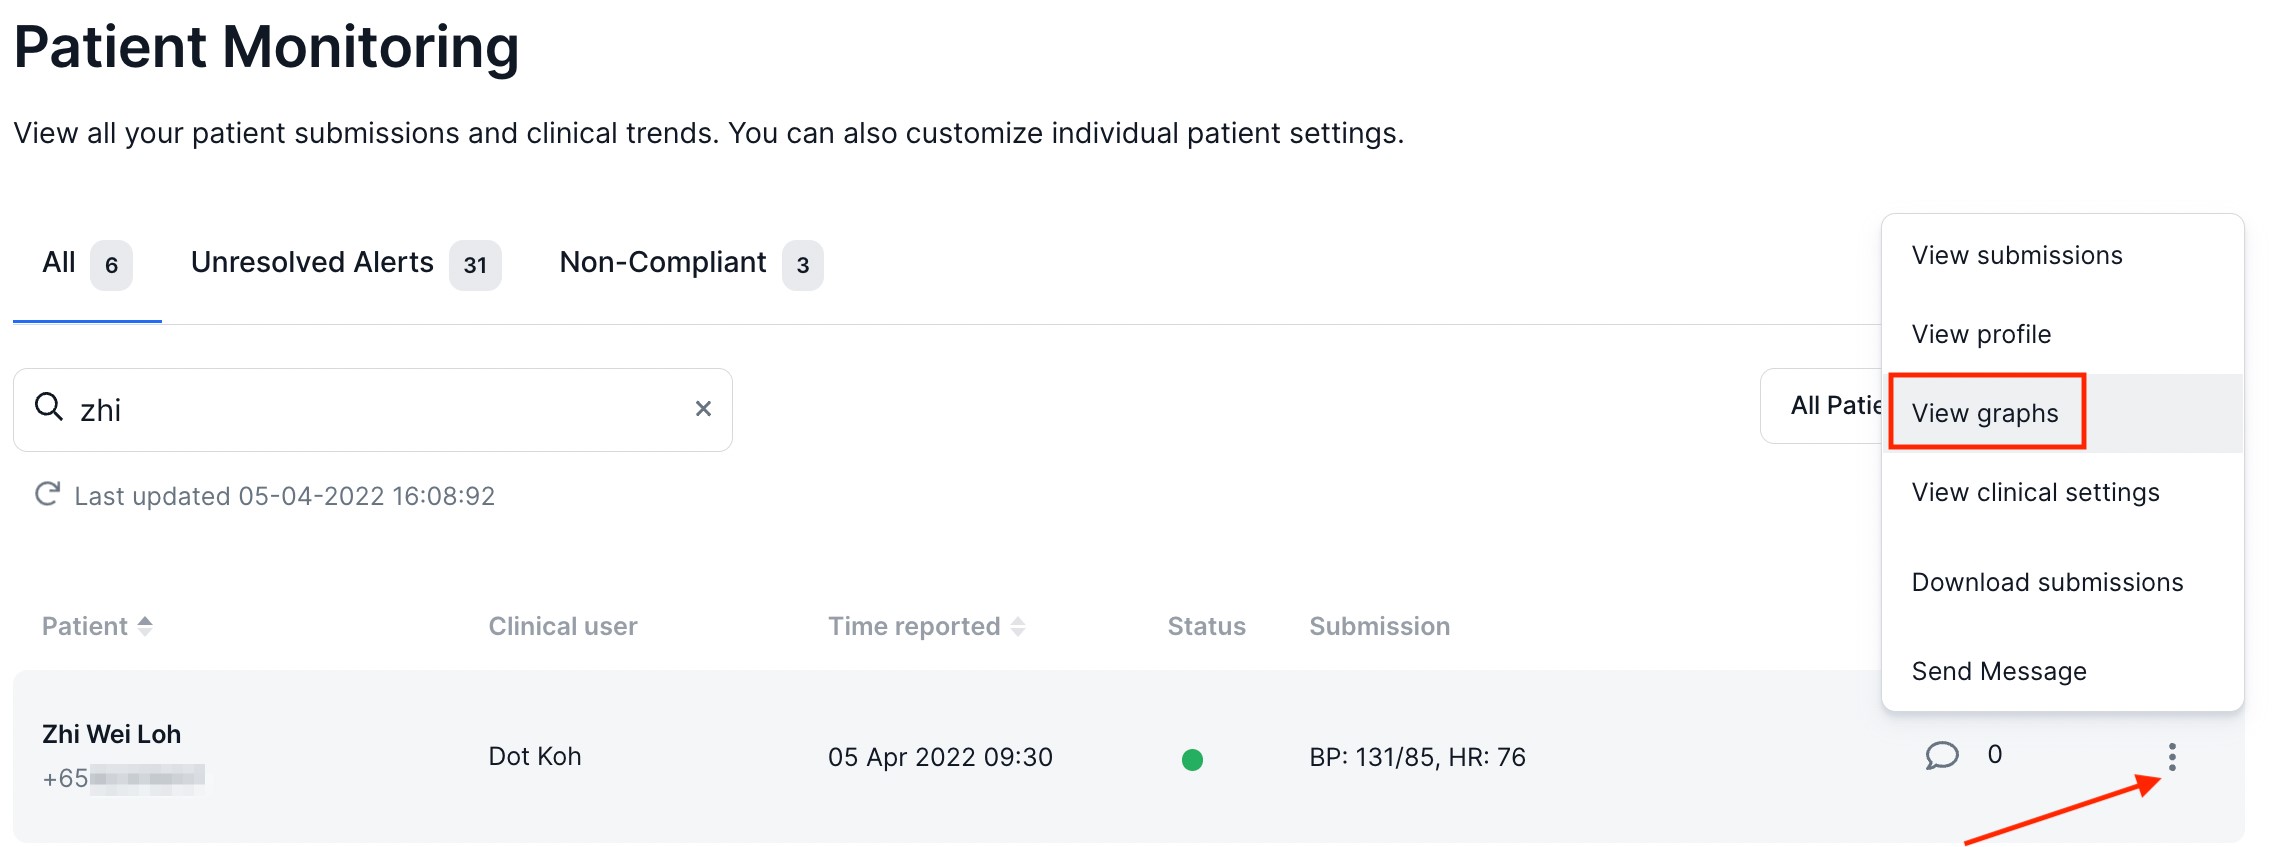
Alternatively, you may click on the More Settings Icon then select View graphs.
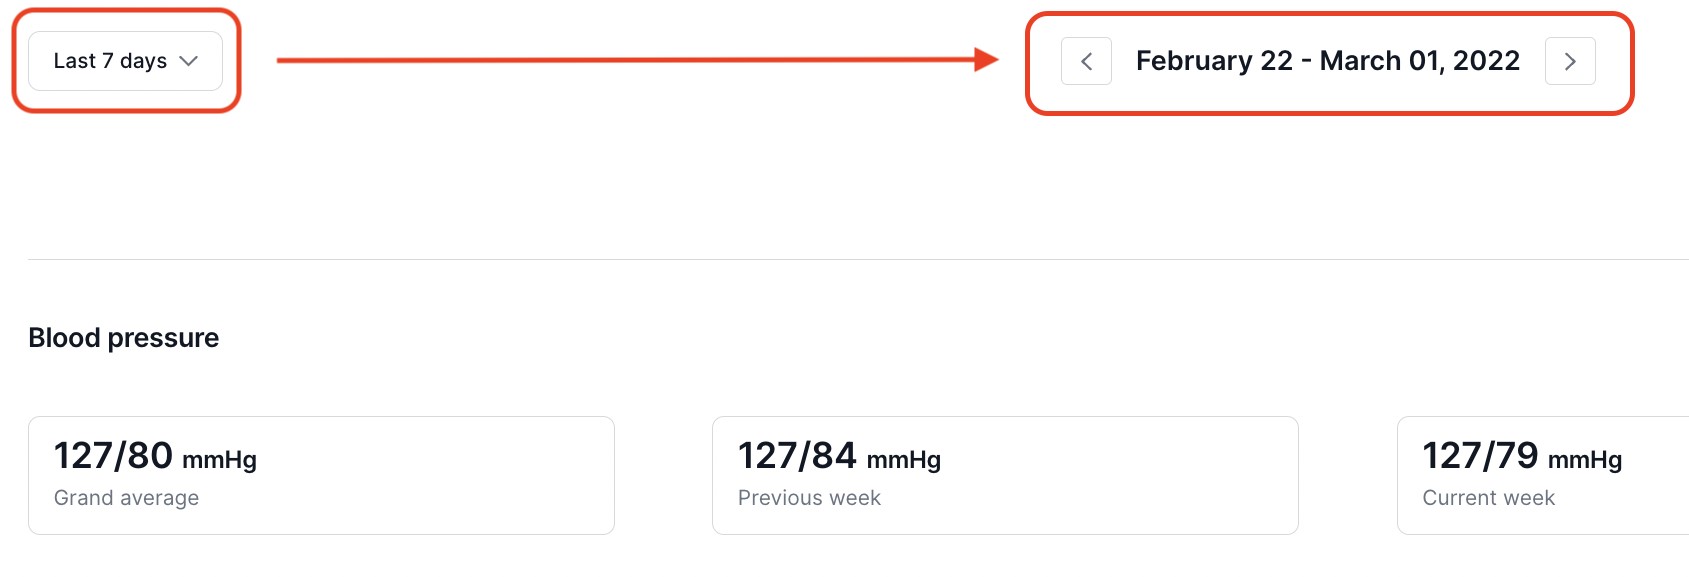
4. To set the duration of the data presented, click on the drop down on the upper left section of the table to set for a period of 1-day, 7-day, 30-days, All-time (duration of the patient's monitoring) or a Custom date range. In the upper center of the Graph, you can click on the arrows of the View Dates to go back or advance to your preferred dates. For more information on this, please see our section on Viewing Patient Trends in Graphs & Tables.
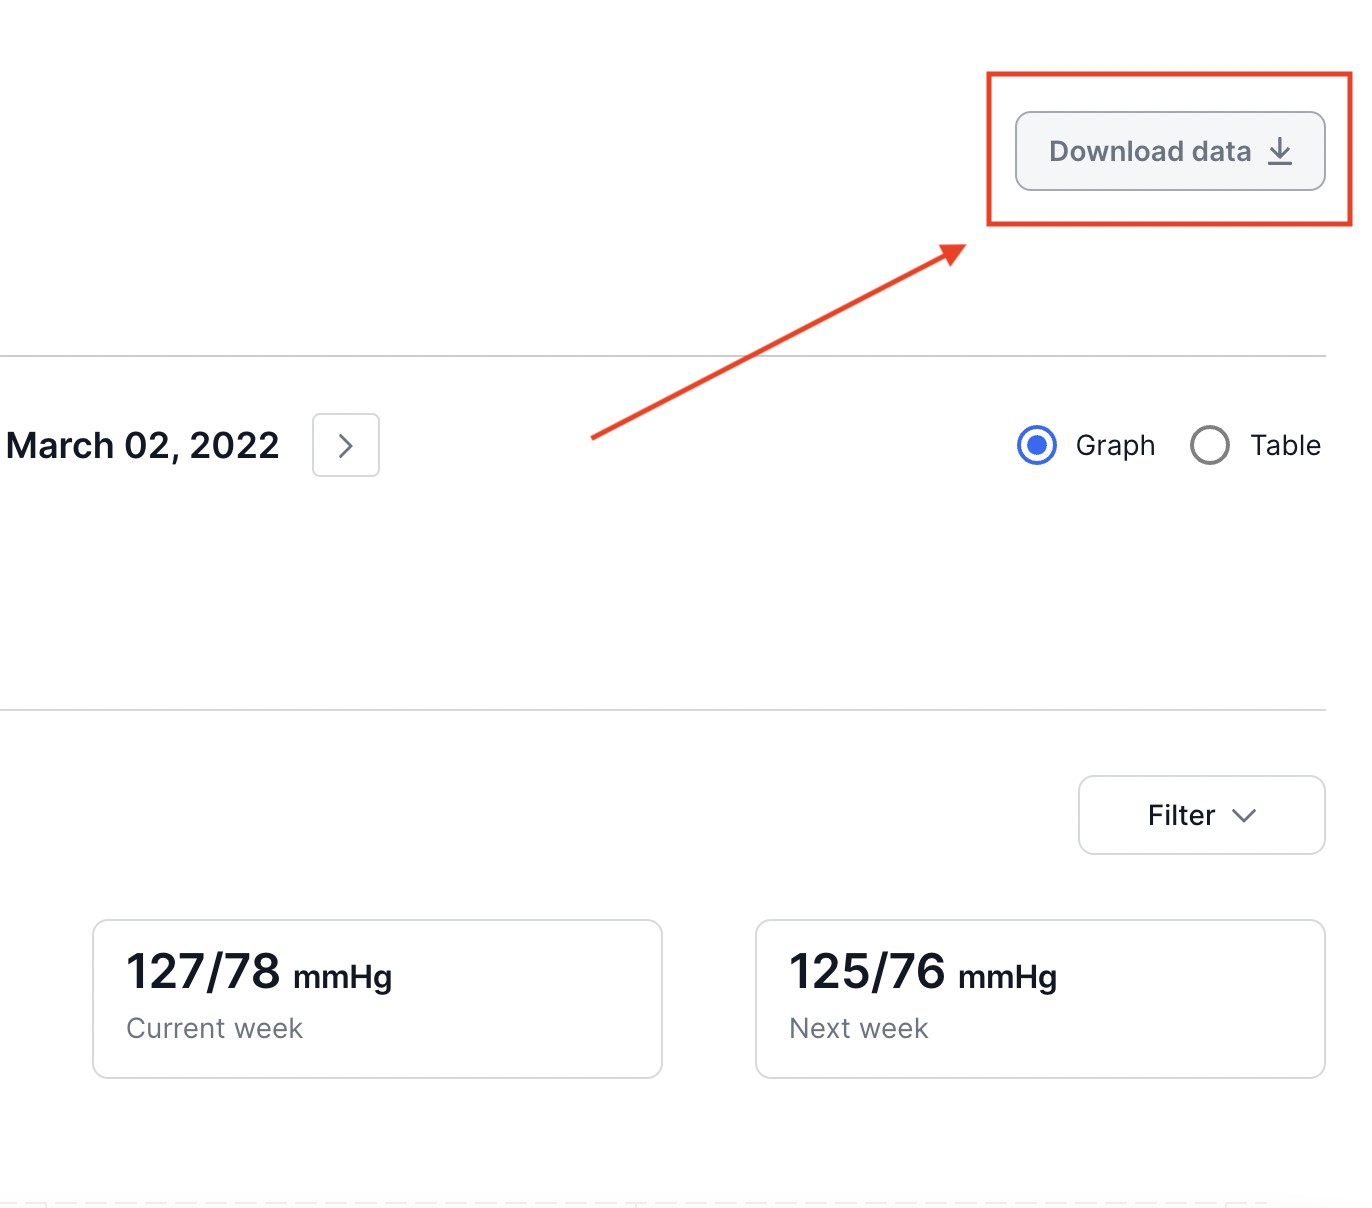
5. Once your duration is set, you are now ready to download your graphical data. Click on Download Data.
6a. To Download your patient's graphical data as a file, select Export Graphs. The output format will automatically select PDF, then click on Export Data.

6b. To Download your patient's tabular data as a file, select Export table. The output format will automatically select PDF, then click on Export Data.

Via Patient List
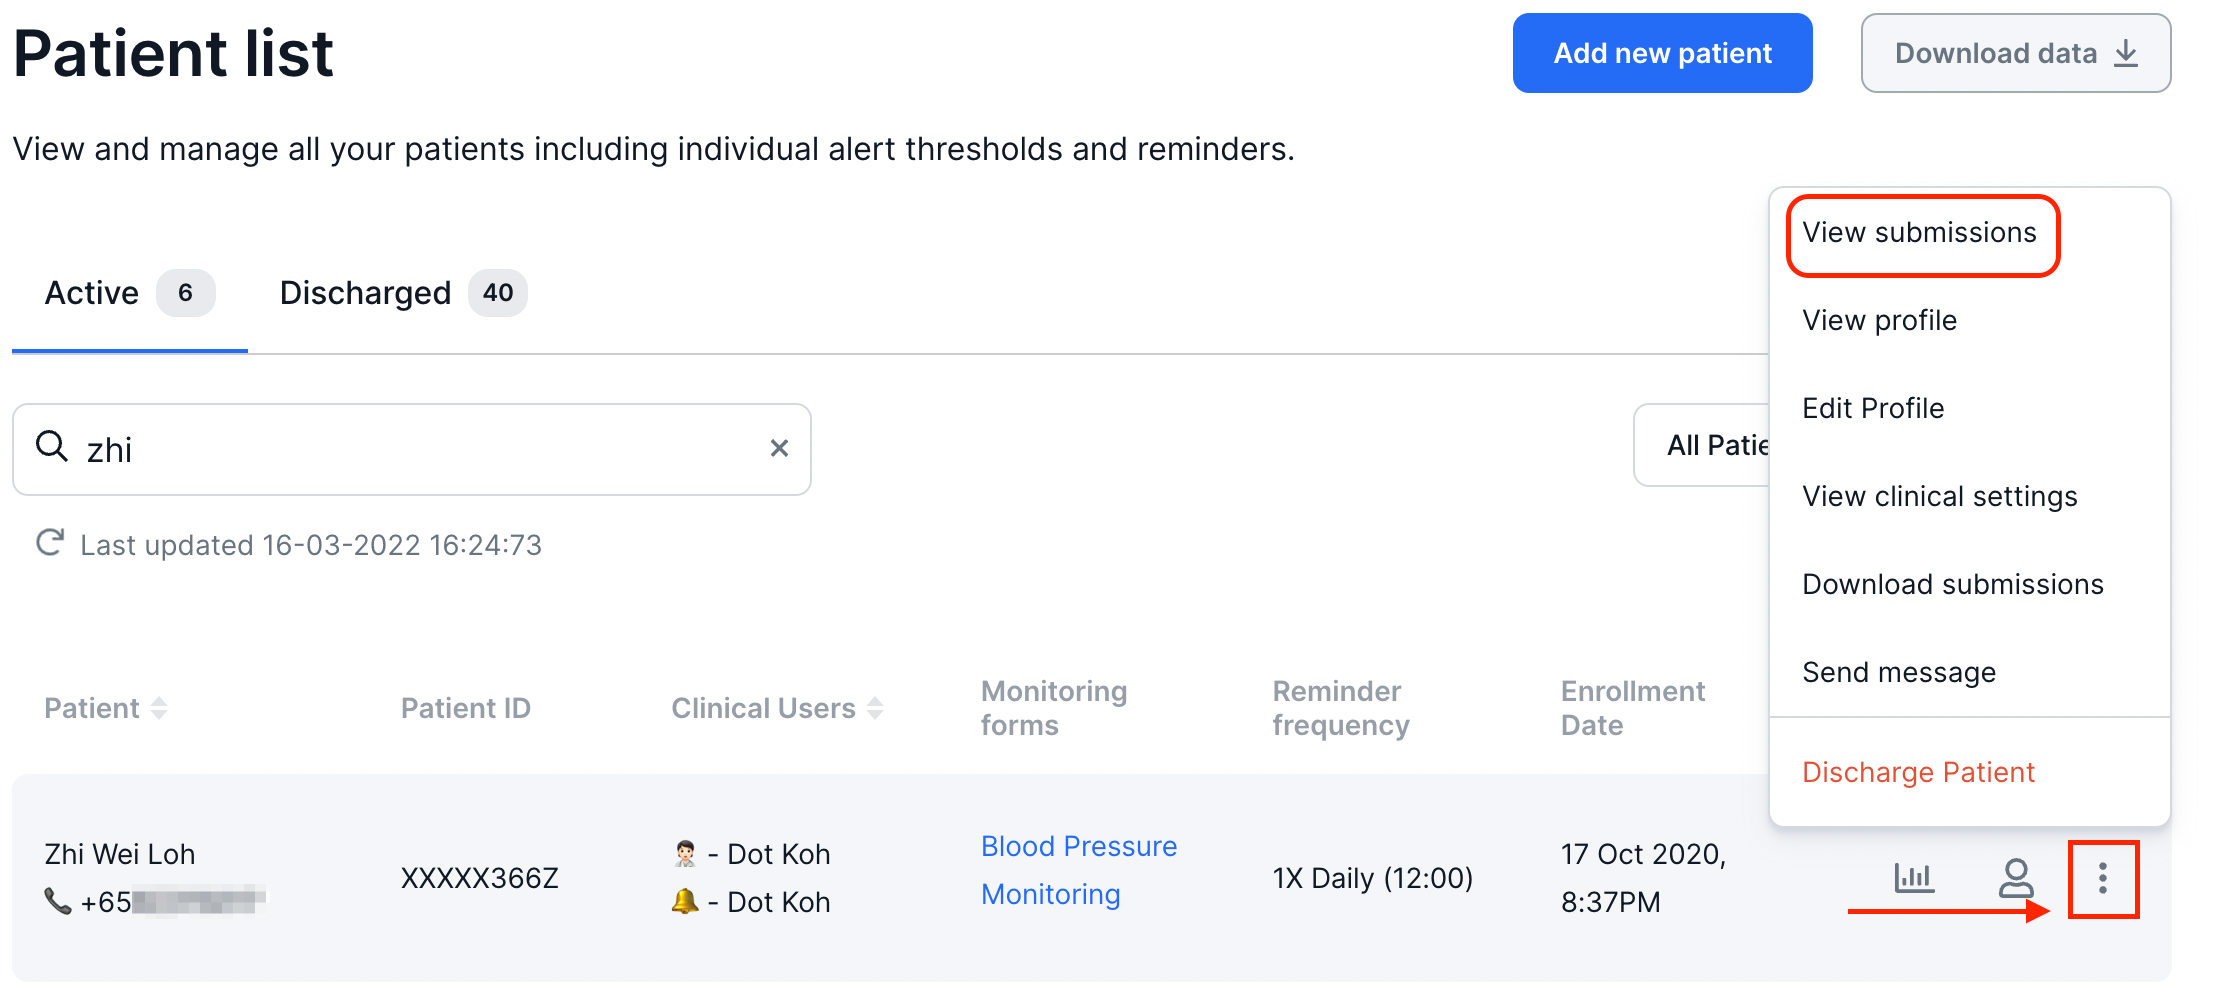
1. In the left side of the Clinical Dashboard, Click Patient List and search for your patient, then click on More Settings then select View submissions.
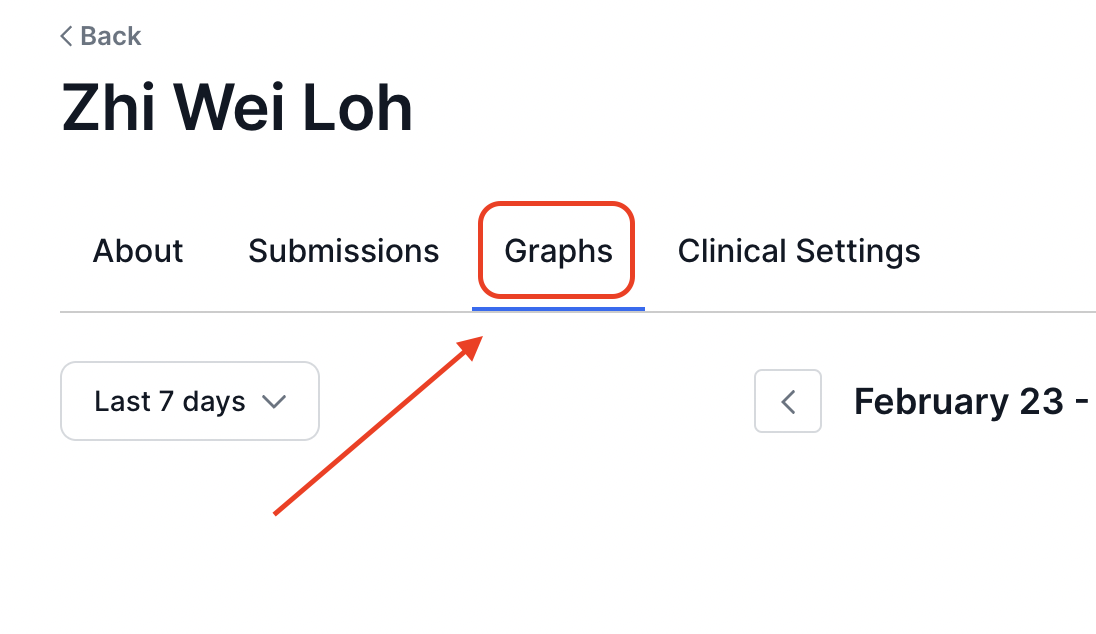
2. Click on the Graphs tab to view your patient's graphs.
Refer to Steps 4 - 7 above to continue.